# Sales forecasting software: how Oliv AI's Forecaster builds the number before reps log in
How Oliv AI's Forecaster agent drafts each rep's forecast, suggests category moves with a reason on each deal, rolls the number up through every manager, and how it compares with other sales forecasting software.
- Applies to: Sales leaders, sales managers, revenue operations and quota-carrying reps
- Status: Live
- Verified: 2026-10-22
- Canonical page: https://www.oliv.ai/product-docs/agents/forecaster/
If you own the forecast number, sales forecasting software is only useful when reps can submit quickly and the number holds up, with the reasons behind every call. Oliv AI's Forecaster agent automates the forecasting process, from collecting deal data to analyzing each deal to the manager's sign-off. It reads your pipeline and builds the forecast before anyone logs in, so reps review and submit instead of typing. It gets more accurate over time by learning from how deals actually close at your company.
## At a glance {#at-a-glance}
| | |
|---|---|
| **What it does** | Drafts the forecast, pressure-tests every category and rolls it up for leadership |
| **Who it's for** | Sales leaders, sales managers, RevOps and quota-carrying reps |
| **Cadence** | Weekly, monthly or quarterly, with separate rep and manager submission days, and several cadences in parallel |
| **Forecast categories** | Commit, Most Likely, Best Case, Pipeline and Closed Won |
| **Where you work** | The **Submissions** tab, the **Boards** tab and each person's submission drawer |
| **Snapshots** | Weekly snapshots and end-of-quarter snapshots you can reopen |
| **Learns from** | Closed deals, pushed deals and your team's feedback on its signals |
| **You connect** | Your CRM: [Salesforce](https://www.oliv.ai/product-docs/integrations/salesforce/), [HubSpot](https://www.oliv.ai/product-docs/integrations/hubspot/) or Zoho |
## What the Forecaster agent is {#what-it-is}
Oliv AI's Forecaster agent analyzes every deal in the pipeline against historical performance, company patterns and deal progression signals. It doesn't move deals or change stages itself. It recommends and nudges, and people make the call.
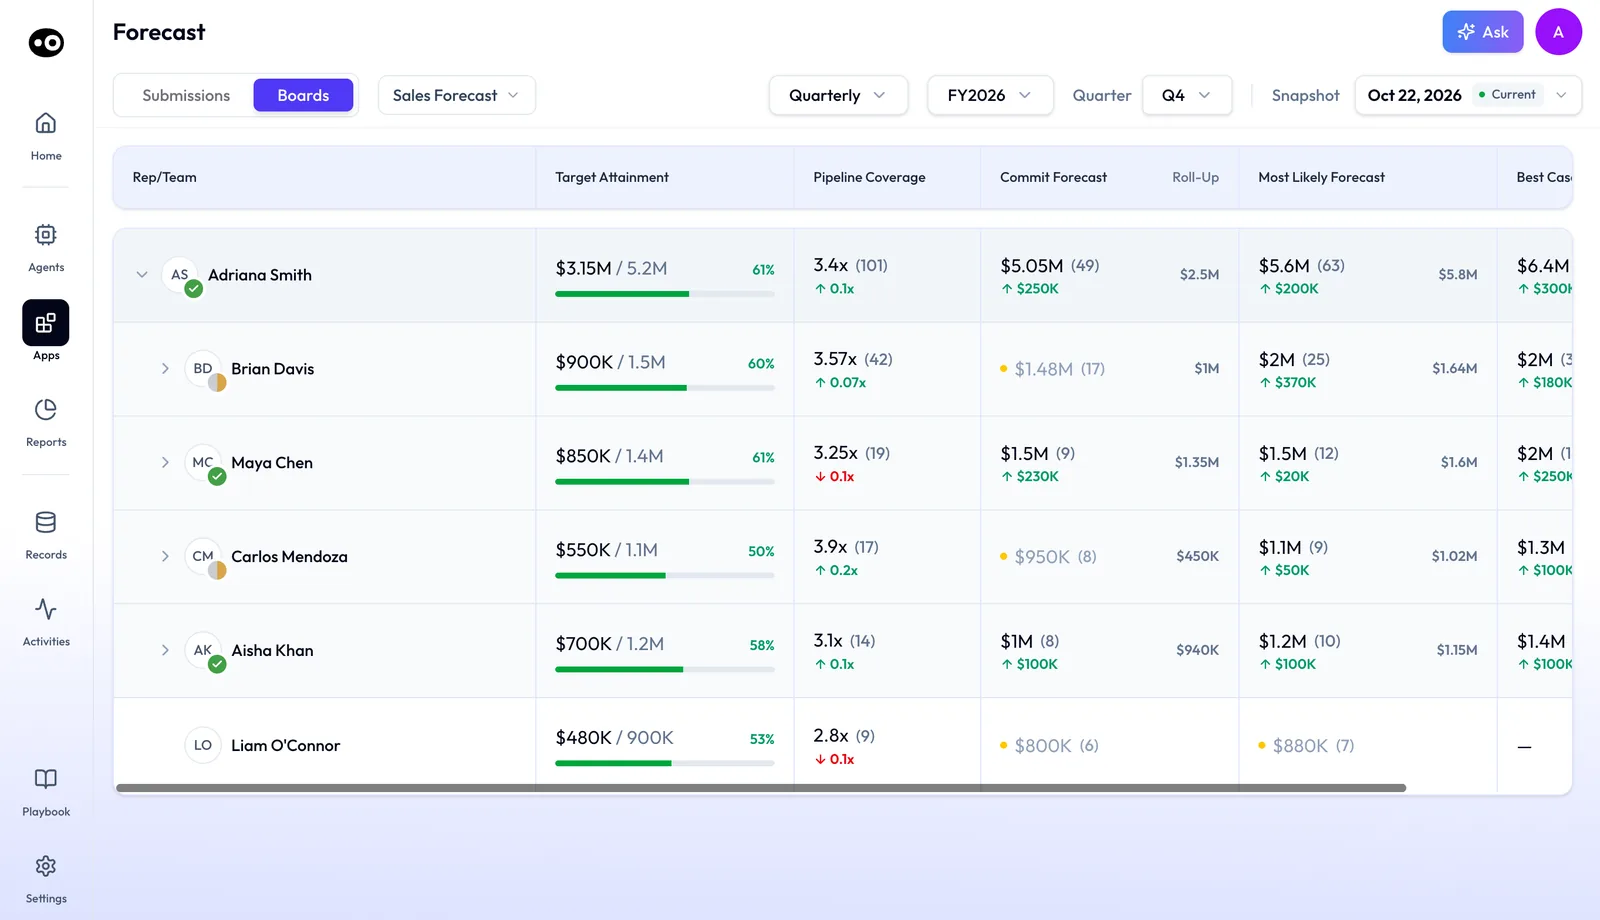
The board is where Forecaster's work rolls up: each manager and rep, their attainment and coverage, and the commit and most likely numbers against the roll-up. The figures here are sample data.
### Three views of the same forecast {#three-views}
- **Submissions.** Each person's number per measurement and period, with **Deals Sum**, **Last Week** and **Roll-Up** beside it. **My Team** shows how many rows each person has submitted, and the header shows the **Due Date**.
- **Boards.** The rolled-up forecast by **Rep/Team**: **Target Attainment**, **Pipeline Coverage**, **Commit Forecast**, **Most Likely Forecast** and **Best Case**. Pick the board, the granularity (**Quarterly**, **Monthly** or **Weekly**), the fiscal year, the period and the snapshot.
- **The submission drawer.** One person's commit, built as **Commit** plus **Adjustment**, with comments and what moved since the last snapshot. Its deal tabs are **Committed Deals**, **Closed Won Deals**, **Most Likely Deals**, **Best Case Deals** and **Pipeline Deals**.
A company can keep several boards, such as **Sales Forecast**, **Renewals Forecast** and a regional new business board.
### The signals it raises {#signals}
| Signal | What it tells you |
|---|---|
| **Deal movement** | A deal can move between categories, such as from Best Case to Commit, based on recent progression |
| **Value adjustment** | The likely value differs from the entered amount, based on historical close rates and trajectory |
| **Risk** | A deal has stalled and may not close in the period, flagged for review |
| **Pipeline health** | Coverage for a period is below target, with a recommended fix |
Suggested category moves appear in the drawer's deal tabs, grouped by direction, such as **Move down to Most Likely**. Each group shows a deal count and a total, and each deal carries a red flag with its risk reason. One click on the target button moves the deal, and **X** dismisses the suggestion. That feedback trains the agent.
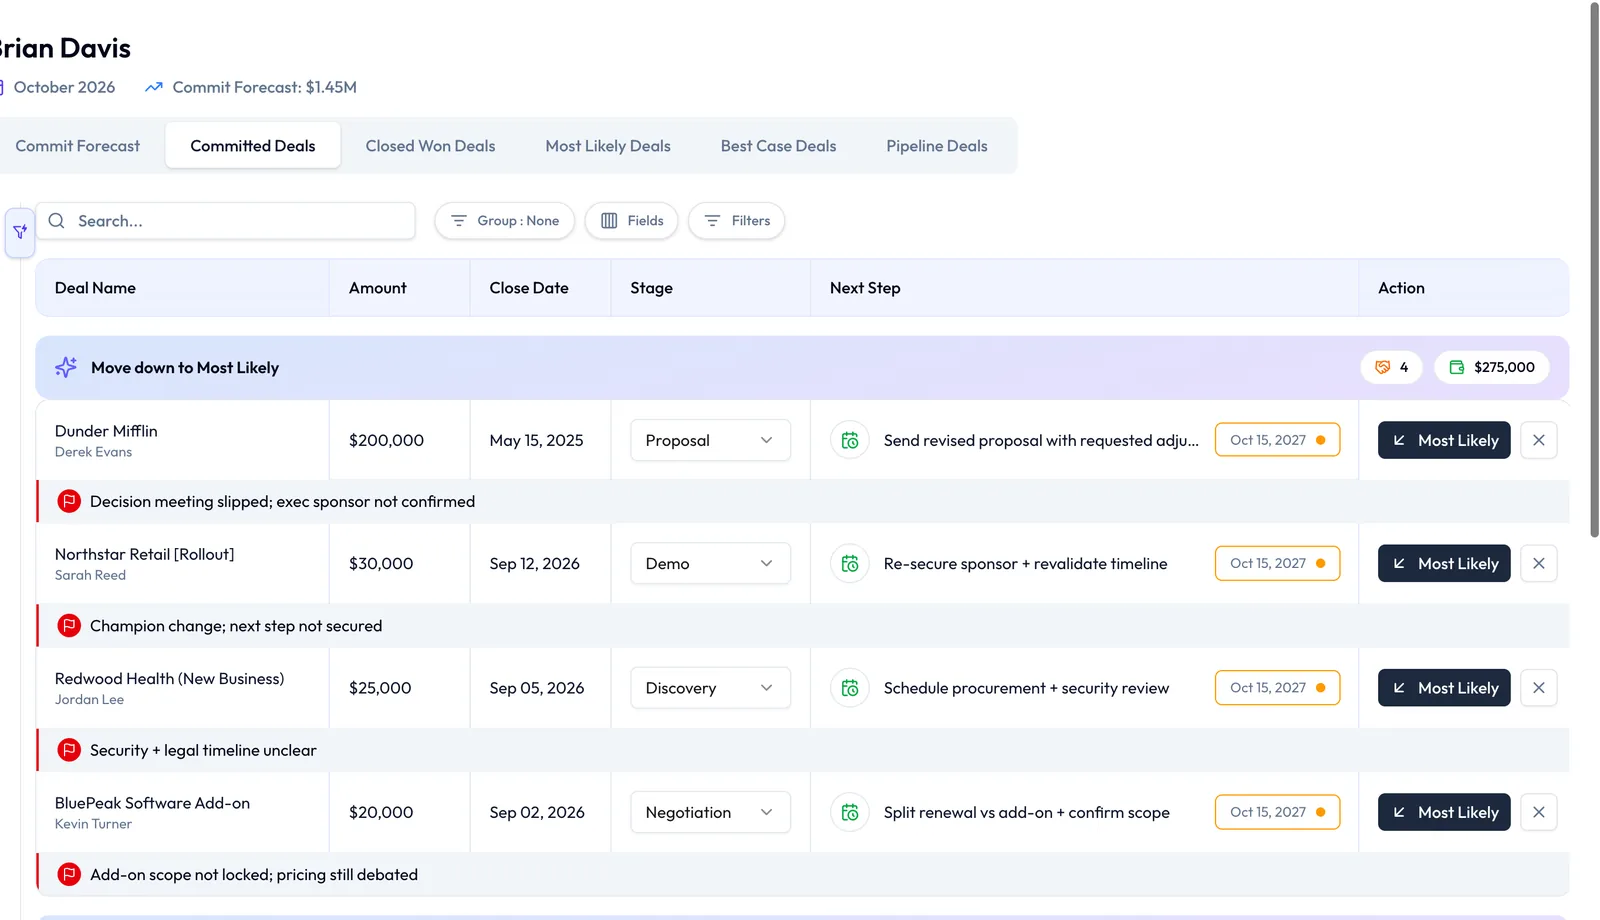
Forecaster's category suggestions are decisions, not changes: every risky commit shows its reason, and the manager moves it in one click or dismisses it. The deal amounts shown are sample data.
## Why the Forecaster agent matters {#why-it-matters}
### What it's for {#what-its-for}
Oliv AI's Forecaster agent is sales forecasting software for teams that want a number they can stand behind on Monday. It takes over the building of the forecast, so people spend their time judging it.
### How it helps {#how-it-helps}
- **Reps stop typing updates.** They open a forecast that is already filled in, check it and submit.
- **Managers review changes, not everything.** Risky commits, sandbagged upside and dead deals are flagged before the call.
- **Leaders see decisions.** The rollup shows what slipped, what moved and why.
- **Accuracy compounds.** Every closed deal makes the next forecast better.
### What happens without it {#without-it}
Without it, the forecast is only as good as each rep's mood that week. Leadership sees a number with no trail behind it: no signals, no reason for the change since last week. A slipping deal shows up when the quarter is already lost, not while there is still time to act.
### Why buyers care {#why-buyers-care}
VPs of Sales, CROs and RevOps leads buy it. The VP of Sales champions it because the weekly rollup burden goes away. RevOps backs it because clean data feeds the model. It pays off most for teams with five or more reps and at least one manager layer.
## The Oliv AI approach to the Forecaster agent {#approach}
{/* 5P */}
It's the last week of the quarter, and a VP of Sales has her commit call with the CRO on Friday. Five managers report to her, each carrying a team number. The CRO wants one figure she can defend, plus the short list of deals it depends on.
The usual run-up is a round of rep updates, manager check-ins and a rollup sheet that comes together late on Thursday. Across a team, that routine can swallow a dozen hours in a week. Even then, the number tends to lean on how hopeful each rep felt.
Yet most of what the commit needs already sits in the pipeline and the calls. Close dates slip, stages stall and deals go quiet, and each of those leaves a trail. The hard part is reading that trail across every deal, every week, without waiting on people.
Oliv AI does that reading with its Forecaster agent. It drafts each rep's forecast before anyone logs in and checks it before the call starts. It flags risky commits and dead deals, and it surfaces sandbagged upside. Managers review only what changed, and the VP gets one rolled-up view with the risk already called out.
Each board keeps weekly snapshots and an end-of-quarter snapshot, so any commit can be reopened as it stood and checked against what actually closed. The comparison further down shows how that learning loop lines up against other forecasting tools.
## Set up Forecaster {#set-up}
1. **Connect your CRM.** [Salesforce](https://www.oliv.ai/product-docs/integrations/salesforce/), [HubSpot](https://www.oliv.ai/product-docs/integrations/hubspot/) or Zoho. Forecaster reads stage, amount, close date and owner for every deal. See the [supported integrations](https://www.oliv.ai/integrations).
2. **Load your roster.** Add reps and managers with the team hierarchy, so forecasts roll up to the right person at every level.
3. **Set targets.** In **Settings › Targets**, **Create Target** adds a target with its type, such as Revenue, and its users. **Active Targets** and **Completed Targets** show each target's overall progress.
4. **Check your measurements.** **Settings › Measurements** holds the numbers the forecast is built from, such as Commit, Most Likely, Best Case and Pipeline Coverage. Each is **Basic** (a sum or count) or **Formula**.
5. **Organize your boards.** Under **Settings › Organisational Settings › Monitoring › Boards**, boards sit in collections such as Forecasting and Regional. Each board has a description, a target and its users.
6. **Add a cadence.** **Organisational Settings › Agents › Forecaster** lists your cadences by **Name**, **Board** and **Interval**. **Add** opens the **New Cadence** wizard, described below.
7. **Plan the weeks.** **Monitoring › Cadence** shows a grid of weeks against measurements, on a **Quarterly** or **Monthly** period, so you can tick which numbers are due in which week.
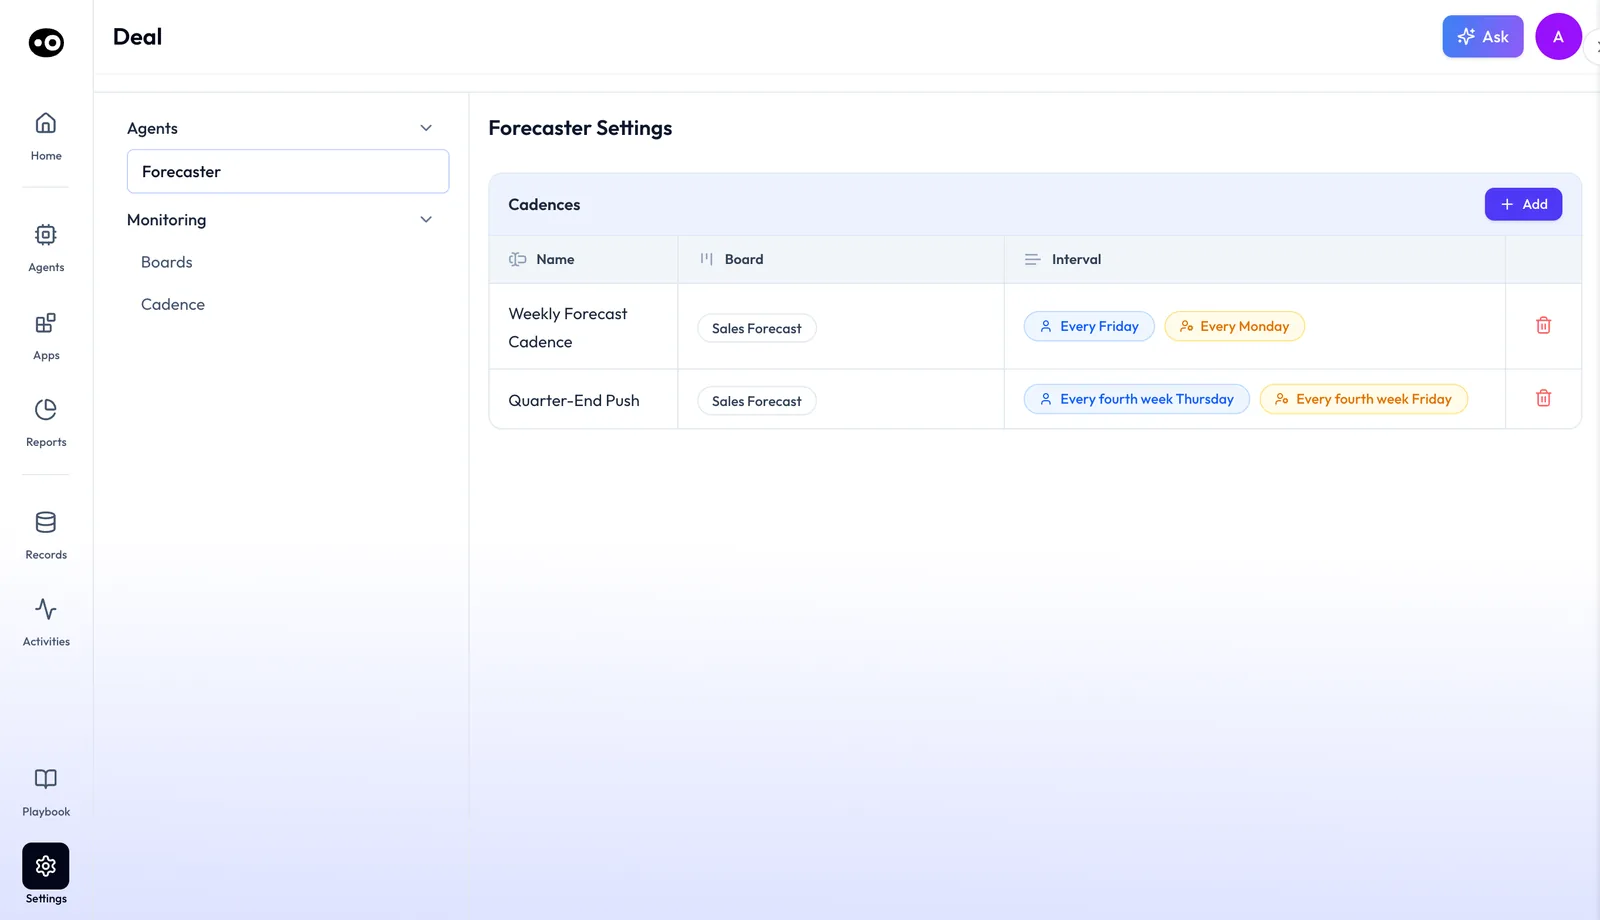
Each cadence ties a board to a rhythm, such as reps every Friday and managers every Monday, which is the schedule Forecaster collects and drafts against.
### Create a cadence {#new-cadence}
The **New Cadence** wizard has three steps: **Overview**, **Boards & Measurements** and **People**. On **Overview**, give the cadence a **Title** and a **Description**, then choose its **Period**: **Weekly**, **Monthly** or **Quarterly**. With a monthly period, set the **Rep Submission Day** and the **Manager Submission Day** by week and day.
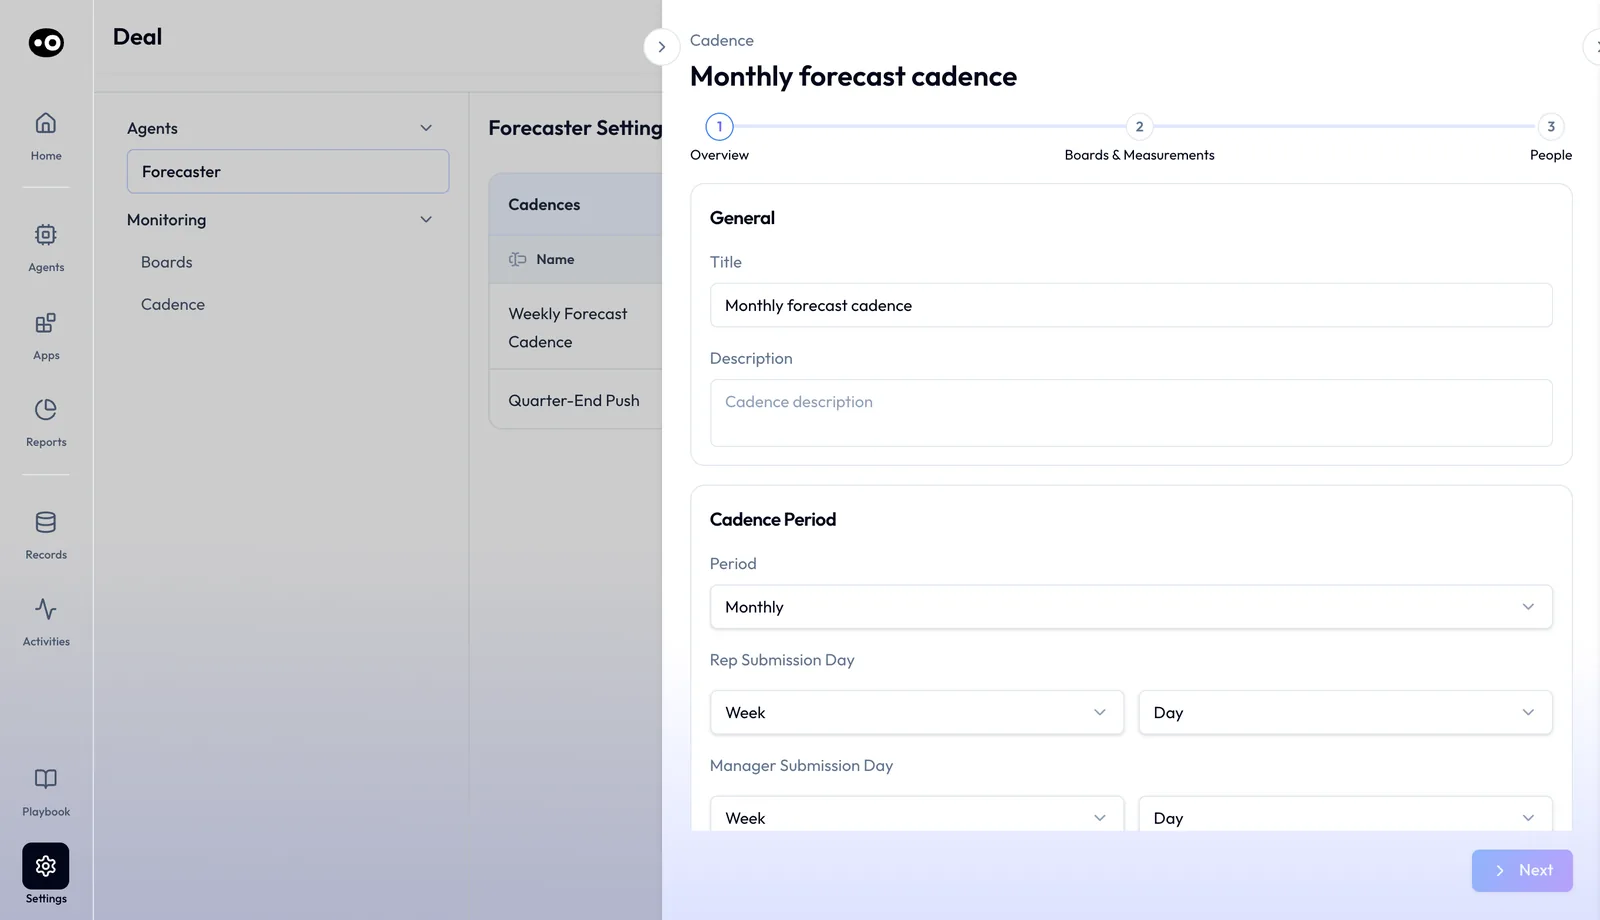
Reps and managers get their own submission day, so the manager's review always lands after the reps have submitted.
Most teams are live within two weeks. Reps need no training: they see a pre-drafted view where they'd normally submit by hand.
## How a sales forecast gets built {#methods}
Before you defend a number on the commit call, work out which reading of the pipeline it rests on. Most forecasts lean on one of three, and each one misses something different. The [guide to AI sales forecasting software](https://www.oliv.ai/blog/best-ai-sales-forecasting-software) covers what to weigh across tools.
### Reps' own calls, rolled up: what each person believes {#rep-calls}
Each rep sorts deals into categories and calls a number. The manager adjusts it, and the total moves up to the next level. HubSpot's forecast category property, for example, offers [Not forecasted, Pipeline, Best case, Commit and Closed won](https://knowledge.hubspot.com/properties/hubspots-default-deal-properties).
A rep's call catches what only the seller knows, such as a buyer's verbal yes or a budget that moves next month. It misses optimism and sandbagging, and it goes stale as soon as a rep stops updating. Gartner's June 2026 abstract on pipeline metrics [advises against doubling down on seller inputs](https://www.gartner.com/en/documents/7952073) and points to pipeline measures instead.
### Stage-weighted pipeline: what the stages imply {#stage-weighted}
Here, each stage [carries a probability of closing](https://knowledge.hubspot.com/object-settings/set-up-and-customize-pipelines). HubSpot's weighted amount is [the deal amount multiplied by that probability](https://knowledge.hubspot.com/properties/hubspots-default-deal-properties), and you add the results up.
The result is a total with nobody's opinion in it, so it makes a useful check on a rep's call. It misses whatever stages can't see. A late-stage deal that went quiet three weeks ago keeps its full weight. Gartner argued in 2019 that [setting close probability from stage completion no longer applies](https://www.gartner.com/en/newsroom/press-releases/2019-11-13-gartner-says-the-traditional-linear-sales-process-no-), because buyers revisit steps instead of moving in a line.
### Deal activity: what is actually happening {#deal-activity}
This method reads the trail each deal leaves: calls held, emails answered, close dates moved and weeks spent in one stage. It catches a commit that looks fine on paper but has stalled, and it can find upside that a cautious rep left out.
It misses anything that never reached a call or an email, such as a decision made in the buyer's budget meeting. It also needs a history of closed deals before you can say what a pattern means at your company.
### Why sales forecasts miss {#why-forecasts-miss}
After a miss, work out which of these four happened before you change the process:
- **The call was hopeful.** A deal stayed in Commit with no recent evidence from the buyer.
- **The data was stale.** Close dates and amounts were weeks old when the number was built.
- **The stage said more than the deal did.** The weighted number counted a deal that had stopped moving.
- **The change came late.** A deal slipped after the last check, and nobody saw it until the next call.
### Which of these Forecaster does {#what-forecaster-does}
Oliv AI's Forecaster agent combines rep calls with deal activity. The rep's call stays: reps review a pre-drafted forecast, adjust it and submit, then managers add their own adjustments and the number rolls up. The agent also checks every deal against your history and its progress so far. It generates its recommendations from what's happening in calls and emails, and its value adjustment signal draws on historical close rates and deal trajectory.
## Run the weekly forecast {#run-the-forecast}
### For reps {#rep-workflow}
Open **Apps › Forecast › Submissions**. See your target for the period, then review the forecast computed from your pipeline in the **Submission** column, next to **Deals Sum** and **Last Week**. Check Forecaster's recommended signals, adjust anything you disagree with, and submit with a comment explaining any changes. It takes about 5 to 10 minutes.
### For managers {#manager-workflow}
In **Submissions**, **My Team** shows each person's progress, such as 9/9 when every row is in, with the due date at the top. Open a person's submission drawer to review their commit: **Commit** plus **Adjustment** equals **Commit Forecast**. Add your own adjustment and a comment, then work through the suggested moves in the deal tabs. For a team of 5 to 10, that's about 15 to 30 minutes in total.
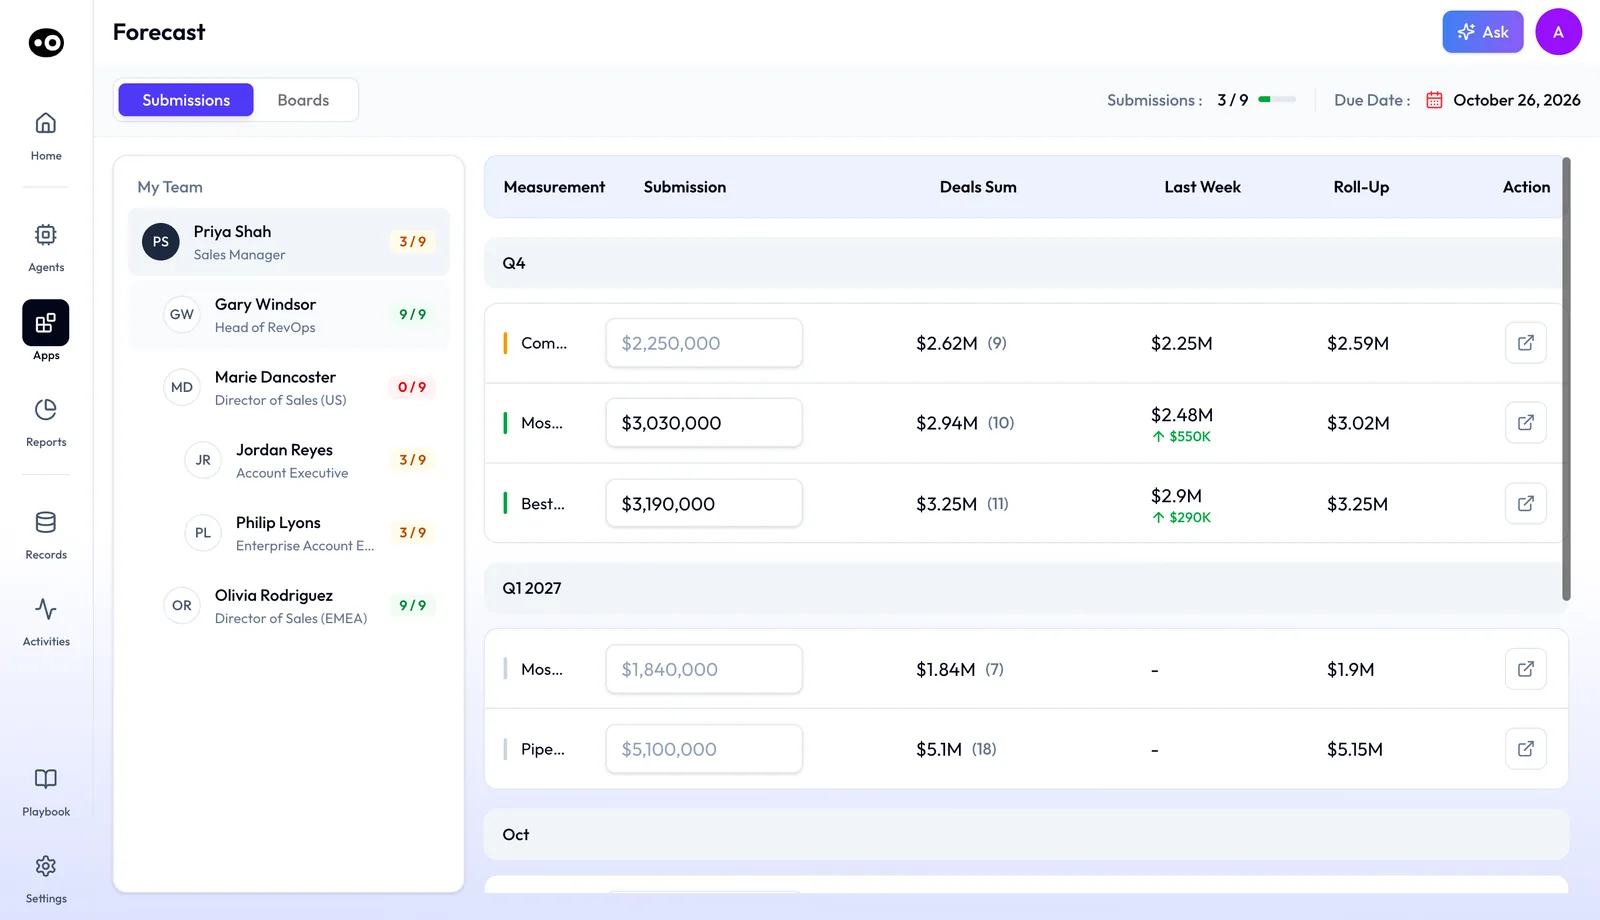
Submissions shows a manager who has submitted and who hasn't, and puts each pre-drafted number next to the deals behind it and last week's figure. All the numbers on this screen are sample data.
The drawer's comments include Forecaster's own note on how it built the number, so you can see what it changed before you add yours. **Deals in this Snapshot** then reconciles the start and end commit: **Total Decrease** (deals that left the category or pushed out) and **Total Increase** (new deals and deals moved in).
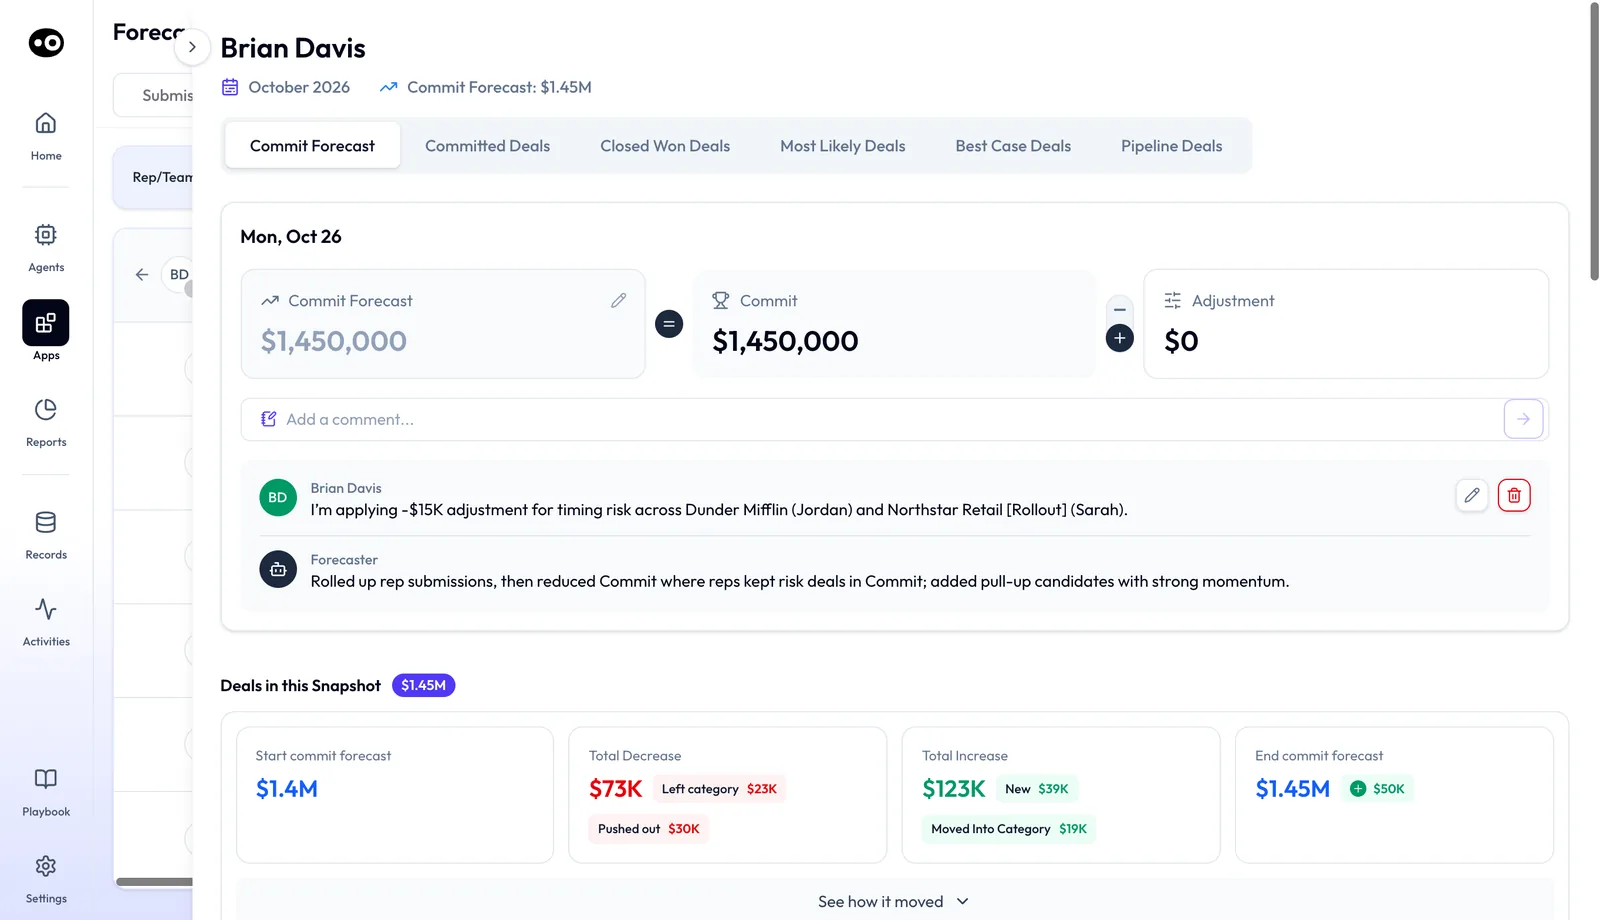
The commit is never a bare number: Forecaster explains how it rolled up the reps and where it cut risk, and the snapshot cards show what moved. These amounts are sample data, not a real team's commit.
On the **Boards** tab, expand a manager's row to see each rep, or click the manager's name to drill into that team. Teams that run [evidence-based forecast commits every Monday](https://www.oliv.ai/blog/run-evidence-based-forecast-commits) start from this rolled-up view. The full meeting routine is in [Run a pipeline review](https://www.oliv.ai/product-docs/workflows/run-a-pipeline-review/).
### Several cadences at once {#cadences}
Monthly, quarterly and pipeline forecasts can run in parallel, each with its own targets and rollup views. One **Submissions** table can hold a quarter, the next quarter, two months and the current week at once. If you forecast quarterly but want monthly visibility, Forecaster can show a monthly equivalent of the quarterly number. Weekly manager calls, monthly reviews and quarterly board forecasts all run from the same signals, targets, rollups and snapshots in [Oliv Forecast](https://www.oliv.ai/oliv-forecast).
## Snapshots and how it learns {#snapshots-and-learning}
Every submission creates a timestamped record. Each board keeps the **Current** snapshot, weekly snapshots with the week they cover, and end-of-quarter snapshots such as **End of Q3**. Pick one from **Snapshot** to see the board as it stood that day.
In the drawer, a **Timeline** lists each weekly submission, marked as scheduled, submitted by Oliv or submitted by the manager. **View as of** reopens a past week, and a **Commit Forecast** chart plots the submission against the actual.
When deals close or push, Forecaster compares the forecast value to the actual outcome. That reconciliation trains the agent. Over time it learns company-specific patterns, such as a deal type that always needs an RFP or a rep who runs two weeks optimistic on timelines. Feedback on its signals trains it too. Read more on [improving forecast accuracy with AI](https://www.oliv.ai/blog/improve-sales-forecast-accuracy-with-ai).
### Operating modes (Beta) {#operating-modes}
Forecaster's operating modes (Beta) let it take over more of the process as it learns your patterns.
- **AI-Assisted (Beta).** Forecaster recommends and your team decides. Managers see where the agent and the rep disagree.
- **AI-Managed (Beta).** Forecaster generates the full forecast, and your team reviews and adjusts. Reps are largely hands-free.
- **AI-Owned (Beta).** Forecaster produces the forecast, and managers review only flagged areas of uncertainty. No rep involvement is needed.
Teams typically move through all three operating modes (Beta) within 6 to 18 months. Managers stay in the loop in every mode.
### Where results go {#where-results-go}
Every Monday, Forecaster's **Weekly Forecast** report lands in **Reports › My Reports**. Its **Current Standing** compares your team's forecast with the AI forecast and shows the gap. Then come **Deals likely to slip**, **Deals to pull in** and **Deals closed last week**, each deal with a **Review Deal** button. **Present** shows the report in the meeting.
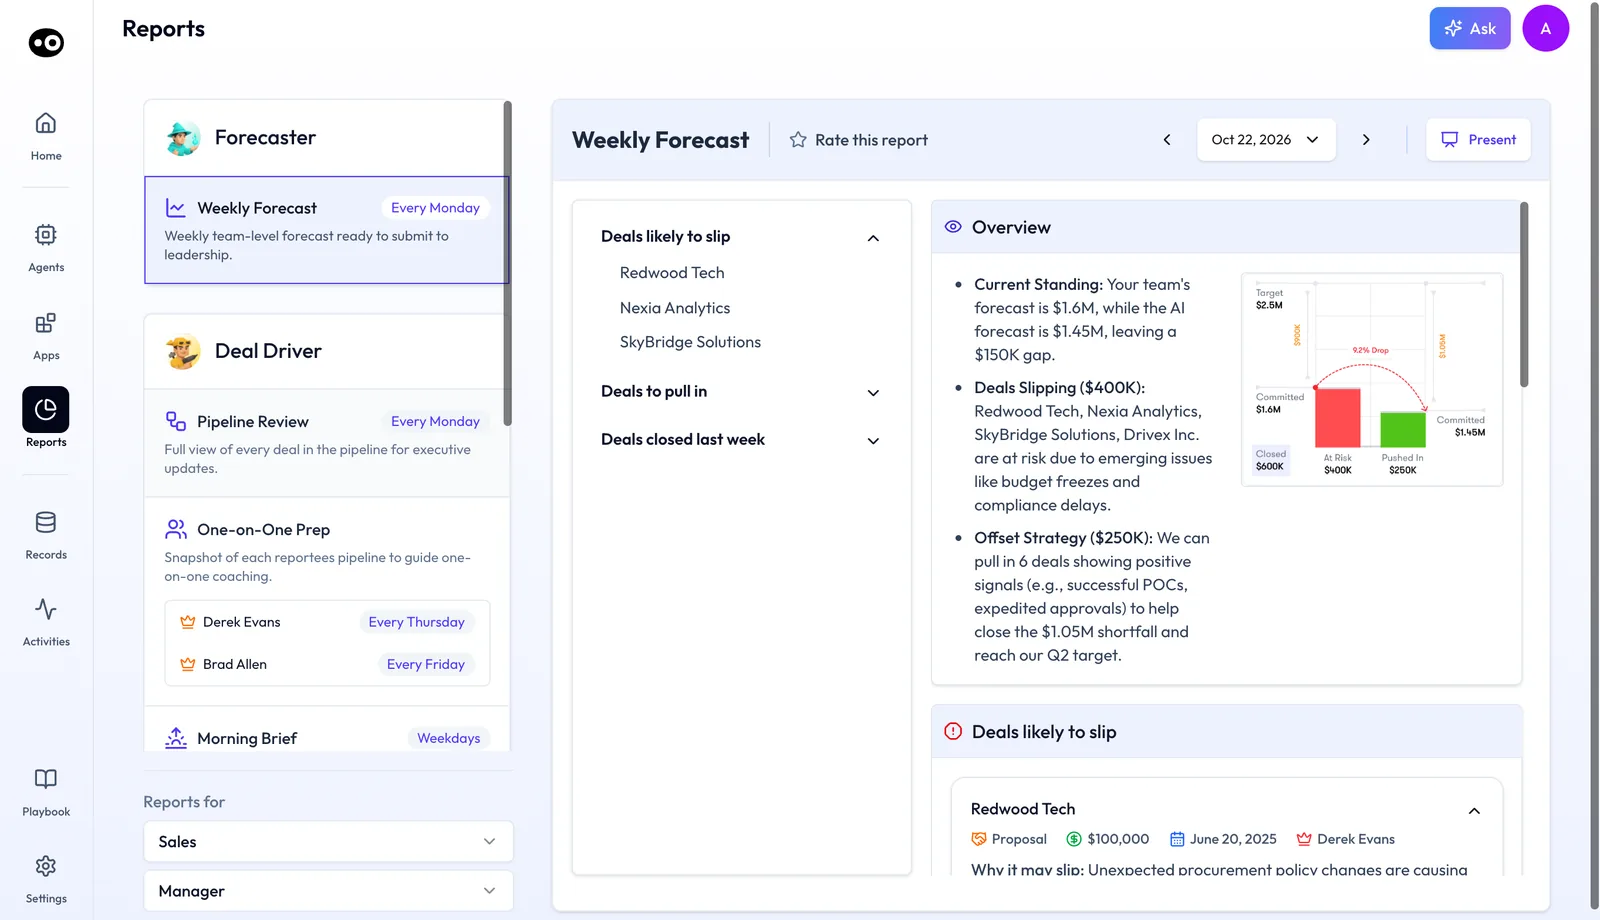
The Weekly Forecast puts the team's call and Forecaster's own number side by side, then lists the deals behind the gap, ready for the Monday review. Both forecast figures are sample data.
Forecaster also posts to the Agent Feed on **Home**, for example when deals shifted forecast categories overnight. Forecast submissions, snapshots, signals and adjustments are kept in Oliv AI. If configured, Forecaster syncs the forecast category and adjusted values back to your CRM. Managers get a weekly team forecast summary with flagged deals in [Slack](https://www.oliv.ai/product-docs/integrations/slack/) or email.
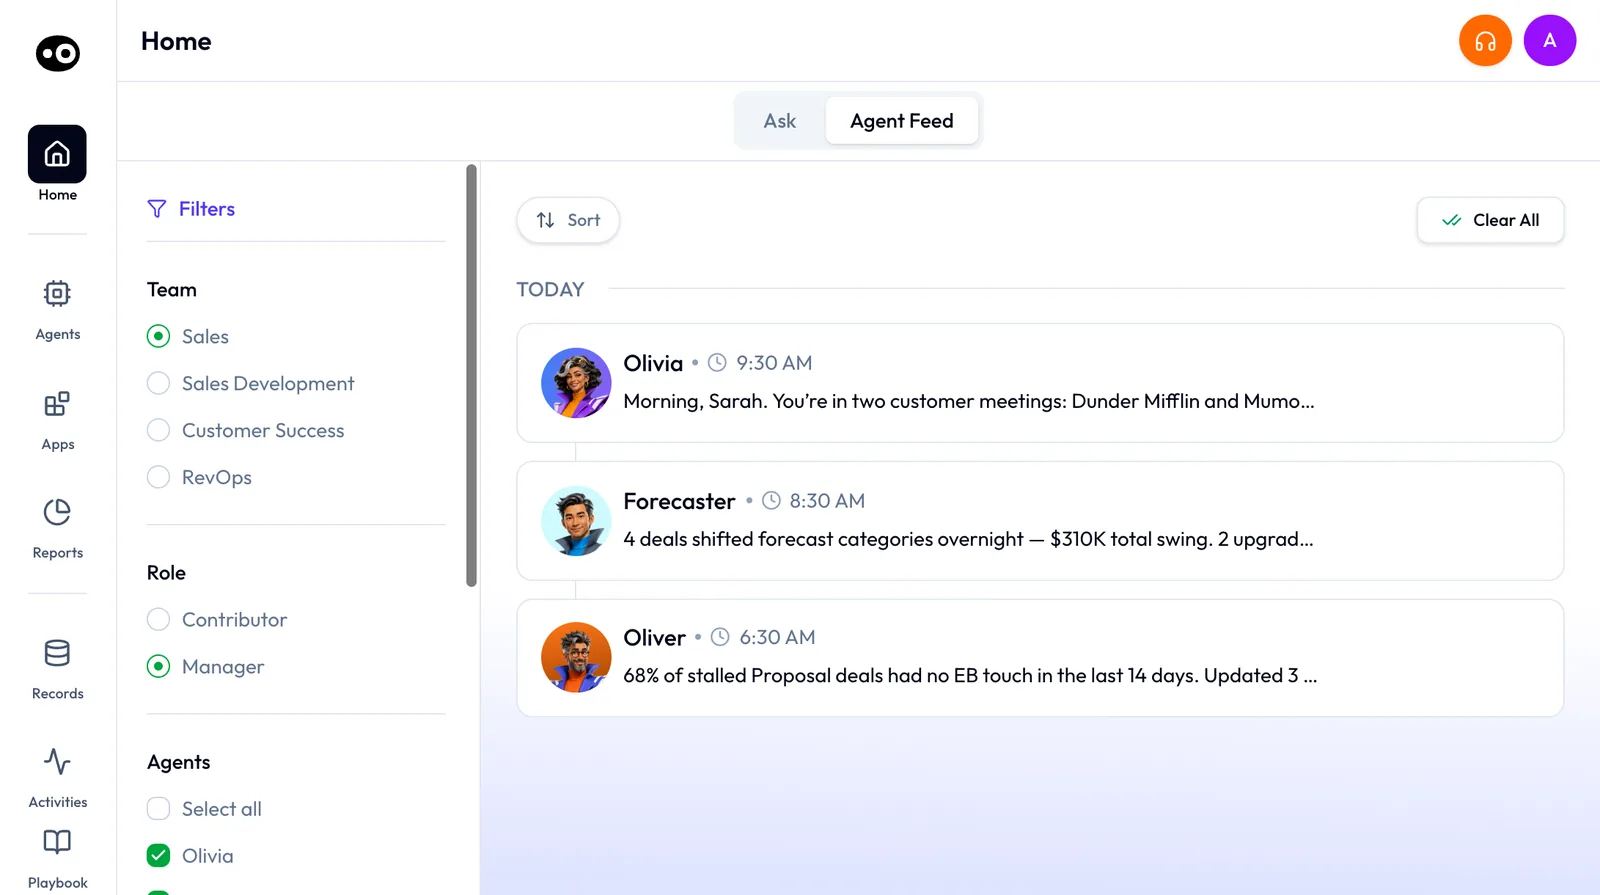
A manager doesn't have to open the board to learn that the forecast moved: Forecaster reports overnight category shifts in the Agent Feed.
## How to measure sales forecast accuracy {#measure-accuracy}
Say your team committed 600,000 USD for the month and 550,000 USD closed. Before you call that close enough, you need to know how far off the call was and which way it leaned. Percentage error and bias answer those two questions, and Oliv AI's Forecaster agent records what you need for both. Score the number as it stood before the period ended, never a version someone edited later.
### Percentage error: how far off the call was {#percentage-error}
Take the commit minus what closed, drop the sign and divide by what closed. Average that across periods when you want one figure. Because the result is a percentage, you can compare a rep carrying 100,000 USD with a team carrying 1,000,000 USD.
Watch for two weak spots. The measure turns [infinite or undefined when the actual is zero, and extreme when it's close to zero](https://otexts.com/fpp3/toolbox.html#sec-simple-methods), so a rep who closed almost nothing can swamp an average. It can also flatter a team, because one rep's overcall cancels another's undercall in the total. Score each rep as well as the team.
### Bias: which way the call leans {#forecast-bias}
Take the commit minus what closed for each period, keep the sign and average the results. A positive result means you overcall, and a negative one means you undercall. A forecasting textbook puts the idea plainly: [when the leftover errors have a mean other than zero, the forecasts are biased](https://otexts.com/fpp3/toolbox.html#sec-simple-methods).
Bias needs several periods before it tells you anything, which is slow on a long sales cycle. It also hides big misses that point in opposite directions, so read it beside percentage error. And it tells you the direction, not the reason. For that, go back to the deals.
### Where Forecaster shows them {#where-forecaster-shows-them}
Open a person's submission drawer first. The **Commit Forecast** chart plots the submission against the actual, which gives you both inputs. The **Timeline** shows each weekly submission and who made it, and **View as of** reopens a past week, so you score the number as it stood.
On a board, pick an end-of-quarter snapshot from **Snapshot** to compare reps and managers as the quarter ended. RevOps can run the same comparison across reps to spot systematic bias. The **Current Standing** view in the Weekly Forecast report adds one more check: the gap between your team's forecast and the AI forecast.
## How to build a sales forecast by hand {#build-by-hand}
Run this routine once and you'll see where the hours go, and what you should still check in any tool. It works for a month or a quarter.
1. **Set the period and the deadlines.** Pick a day for reps and a later day for managers, so reviews land after submissions.
2. **Export the open deals.** Pull owner, stage, amount, close date and forecast category for every deal in the period.
3. **Fix what you can.** Chase stale close dates and missing amounts. Flag whatever you can't fix before the deadline.
4. **Collect each rep's call.** Each rep places deals in Commit, Best Case or Pipeline, then totals each category.
5. **Test the commits in the 1:1.** For each committed deal, ask what the buyer did last, what happens next and who signs. Move a deal down when those answers are missing.
6. **Record your adjustment separately.** Write down the rep's commit, your change and your reason. Never overwrite the rep's number, or you can't score either call later.
7. **Roll it up.** Add up each team's commit and send it to the next level, with the short list of deals it depends on.
8. **Freeze a dated copy.** Compare it with next week's copy to see what moved.
9. **Score it at the end of the period.** Compare the frozen commit with what closed, for each rep and for the team.
The routine tends to break in three places. Late updates push step 7 to the night before the call. Spreadsheet copies drift apart, so nobody is sure which one was submitted. And step 9 gets skipped when nobody kept the frozen copy.
### The same job with Forecaster {#same-job-forecaster}
Oliv AI's Forecaster agent takes over the building, and you keep the checking.
| By hand | In Forecaster | What you still check |
|---|---|---|
| Set the period and deadlines | A cadence sets the period and the rep and manager submission days | The **Due Date** and the **My Team** counts |
| Export and fix the deals | The agent reads stage, amount, close date and owner from your CRM, and CRM Manager keeps those fields current | That CRM Manager is active before the agent analyzes the deals |
| Collect each rep's call | Each rep opens a pre-drafted forecast and reviews the signals | The comment on any change a rep made |
| Test the commits | Risky commits are flagged, with a risk reason on each deal | Each suggested move: accept it or dismiss it with **X** |
| Record your adjustment | **Commit** plus **Adjustment** equals **Commit Forecast**, with comments alongside | Forecaster's note on how it built the number |
| Roll it up | **Boards** rolls reps up to their manager and managers up to their leader | The roll-up at each level, by expanding a row |
| Freeze a dated copy | Every submission is timestamped, and an automatic snapshot runs every Monday | What moved, in **Deals in this Snapshot** |
| Score it | The **Commit Forecast** chart plots the submission against the actual | Percentage error and bias, by rep and by team |
### Worked example: one manager's commit against what closed {#worked-example}
This is an illustrative calculation with sample figures, not an Oliv AI output. A manager with three reps freezes a monthly commit and then scores it once the month closes. The manager cut Rep A's call by 50,000 USD after the 1:1.
| Rep | Rep's commit (USD) | Manager's adjustment (USD) | Commit forecast (USD) | Closed (USD) | Error: forecast minus closed (USD) | Percentage error |
|---|---|---|---|---|---|---|
| Rep A | 300,000 | -50,000 | 250,000 | 200,000 | +50,000 | 50,000 ÷ 200,000 = 25% |
| Rep B | 200,000 | 0 | 200,000 | 250,000 | -50,000 | 50,000 ÷ 250,000 = 20% |
| Rep C | 150,000 | 0 | 150,000 | 100,000 | +50,000 | 50,000 ÷ 100,000 = 50% |
| **Team** | **650,000** | **-50,000** | **600,000** | **550,000** | **+50,000** | **50,000 ÷ 550,000 = 9.1%** |
The team's 9.1% looks close, but the reps' errors average (25 + 20 + 50) ÷ 3 = 31.7%. Rep B's undercall hides part of what Rep A and Rep C overcalled. The manager's cut also shows up here. Without it, the team's error would have been 100,000 ÷ 550,000 = 18.2%.
Now add the next two months for the same team.
| Month | Commit forecast (USD) | Closed (USD) | Error: forecast minus closed (USD) | Percentage error |
|---|---|---|---|---|
| Month 1 | 600,000 | 550,000 | +50,000 | 50,000 ÷ 550,000 = 9.1% |
| Month 2 | 500,000 | 470,000 | +30,000 | 30,000 ÷ 470,000 = 6.4% |
| Month 3 | 700,000 | 660,000 | +40,000 | 40,000 ÷ 660,000 = 6.1% |
| **Mean** | | | **(50,000 + 30,000 + 40,000) ÷ 3 = +40,000** | **(9.1 + 6.4 + 6.1) ÷ 3 = 7.2%** |
A 7.2% average error sounds fine on its own. The bias says more: the team came in high all three months, by 40,000 USD on average. So in this example, you'd start with Rep C's committed deals and ask what they had in common, instead of asking the whole team to forecast harder.
## How Forecaster works with other agents {#works-with}
### CRM Manager {#with-crm-manager}
[Oliv AI's CRM Manager agent](https://www.oliv.ai/product-docs/agents/crm-manager/) is the data foundation. It pulls from call transcripts and meeting notes to keep stage, close date and amount current, so Forecaster builds from today's deal state. Read why [clean CRM data drives predictability](https://www.oliv.ai/blog/crm-data-strategy-cro-revenue-predictability).
### Deal Driver {#with-deal-driver}
Forecaster surfaces deals that don't add up, such as closing-date conflicts. [Oliv AI's Deal Driver agent](https://www.oliv.ai/product-docs/agents/deal-driver/) fills in the context: last touchpoint, open next steps and days since last activity. A manager can review the flagged items in minutes instead of reading the whole pipeline.
### Oliver {#with-oliver}
When leadership needs a cross-deal breakdown, such as why one segment is lagging, [Oliv AI's Oliver agent](https://www.oliv.ai/product-docs/agents/oliver/) runs it. Oliver uses the structured data layer that Forecaster and CRM Manager maintain.
### Olivia {#with-olivia}
[Oliv AI's Olivia agent](https://www.oliv.ai/product-docs/agents/olivia/) is the front-facing master agent for reps. Forecaster stays in the background, drafting the forecast each rep reviews. The **Ask** button on the Forecast header opens Olivia beside the board, so you can ask a question without leaving it.
## Who uses Forecaster, and how {#who-uses-it}
### Sales leaders {#sales-leaders}
VPs of Sales and CROs get one forecast view, split by motion, with risk already called out. Leadership sees what moved, what slipped and where the gap is before the commit call. More in [Oliv AI for sales leaders](https://www.oliv.ai/blog/oliv-ai-sales-leader-vp-sales-agent-features) and a [CRO's guide to forecast accuracy](https://www.oliv.ai/blog/sales-forecast-accuracy-cro).
### Sales managers {#sales-managers}
Managers review submissions, add their own adjustments and sign off. They spend time on the deals Forecaster flagged, not the whole board. For the view of a single deal, see the [Deal Driver agent docs](https://www.oliv.ai/product-docs/agents/deal-driver/). Read more about Oliv AI for [sales managers](https://www.oliv.ai/sales-managers).
### Revenue operations {#revops}
RevOps configures cadences, targets and metrics during onboarding and watches forecast against actual to spot systematic bias. Learn how Oliv AI works for [revenue operations teams](https://www.oliv.ai/revops).
### Account executives {#account-executives}
Reps open a pre-filled forecast, adjust a deal or two and submit in minutes. The rest of their week is in [Run deals as an account executive](https://www.oliv.ai/product-docs/use-cases/ae-run-deals/).
## How Oliv AI compares for sales forecasting software {#compare}
Most forecasting tools give reps a board to fill in. Forecaster drafts the rep's forecast, suggests category moves with a reason on each deal, and learns from every closed deal, across monthly and quarterly forecasts at once. Oliv AI is the only platform in this table that does all four.
AI sales forecasting features, from each platform's public documentation:
| Platform | Rep's forecast pre-drafted | Suggested category moves, with reasons | Learns from your closed deals | Monthly and quarterly in parallel |
|---|---|---|---|---|
| **Oliv AI** | Yes | Yes | Yes | Yes |
| **Gong** | [Rep submits each number](https://help.gong.io/docs/forecast-update-your-forecast) | Partly ([suggested updates in one column](https://help.gong.io/docs/set-up-forecast-boards)) | Yes ([trained on historical deal outcomes](https://help.gong.io/docs/understanding-ai-deal-predictor)) | Yes ([monthly, quarterly or both](https://help.gong.io/docs/configurable-forecast-article-1)) |
| **Outreach** | [Manager edits and submits the call](https://support.outreach.io/support/solutions/articles/159000425492-how-to-use-the-forecast-rollup) | Partly ([risk signals in rollup, Beta](https://support.outreach.io/support/solutions/articles/159000420906-how-to-configure-risk-signals-in-forecast-rollup-beta-)) | Not in docs | Yes ([parallel forecasts](https://support.outreach.io/support/solutions/articles/159000426069-creating-and-editing-forecasts-in-outreach)) |
| **Avoma** | [Reps enter their submission](https://help.avoma.com/forecast-submission-and-history) | Partly ([forecast risk alerts in Slack](https://help.avoma.com/slack-integration-setup-guide)) | Not in docs | Partly ([one period for the whole org](https://help.avoma.com/forecast-settings)) |
| **Fireflies** | Not in docs | Partly ([deal risks flagged early](https://guide.fireflies.ai/articles/6941626485-getting-started-with-fireflies-crm-deal-intelligence)) | Not in docs | Not in docs |
*Yes: documented and built in. Partly: documented with a limit, shown in brackets. Not in docs: not found in the vendor's public documentation.*
### Why Oliv AI is the stronger choice for sales forecasting software {#compare-stronger}
- **The forecast is built before anyone logs in.** Forecaster pre-drafts each rep's forecast, so reps review and submit in minutes. In Gong, a panel opens where [you submit your number for the selected category](https://help.gong.io/docs/forecast-update-your-forecast). Compare [Oliv AI vs Gong](https://www.oliv.ai/blog/gong-vs-oliv).
- **Every suggested move is a decision you control.** Each suggested category move names the risk behind it, and the manager accepts it in one click or dismisses it. Avoma sends [forecast risk alerts to Slack with its Revenue Intelligence add-on](https://help.avoma.com/slack-integration-setup-guide). Compare [Oliv AI vs Avoma](https://www.oliv.ai/blog/avoma-vs-oliv-ai).
- **Learning comes from your own outcomes.** Forecaster compares each forecast with what closed and learns your company's patterns. Outreach's Scenario Planner [simulates forecast projections from inputs you review and adjust](https://support.outreach.io/support/solutions/articles/159000425531-overview-of-forecasting-and-pipeline-management). Read [how Gong and Outreach compare](https://www.oliv.ai/blog/gong-vs-outreach).
*Competitor details checked against each vendor's public documentation on 21 October 2026. Features and plans change, so confirm with the vendor before you decide.*
## Limits and things to know {#limits}
- **It recommends and doesn't move deals on its own.** Forecaster doesn't change deal stages or categories itself. It suggests a move, and a person accepts it.
- **It isn't deal scoring.** Oliv AI's Deal Insights layer evaluates deal health, and Forecaster consumes those insights.
- **It isn't a real-time alert tool.** Deal Driver handles alerts on deals as they happen.
- **It isn't a coaching tool.** Coach handles rep development.
- **It's only as good as the data.** CRM Manager should be active so deal fields are current before Forecaster analyzes them.
- **Operating modes are Beta.** AI-Assisted, AI-Managed and AI-Owned are all labeled Beta.
## Common questions {#common-questions}
#### How long before Forecaster can run without my input? {#faq-time-to-autonomy}
It depends on your sales cycle. For 3 to 6 month cycles it's usually 6 to 9 months, and for 12 month enterprise cycles, 12 to 18 months. Time savings show up from week one.
#### What if Forecaster makes a bad recommendation? {#faq-bad-recommendation}
You dismiss it with **X**. Forecaster learns from that, and every decision you make helps it recognize your company's patterns.
#### What if a rep or manager disagrees with a signal? {#faq-disagree}
They override it, with their own value or adjustment. The system learns from that feedback and adjusts future recommendations.
#### Can we run monthly and quarterly forecasts at the same time? {#faq-cadences}
Yes. Forecaster supports several cadences in parallel, each with separate targets and rollup views. Boards switch between quarterly, monthly and weekly views.
#### Does the forecast roll up through more than one manager? {#faq-rollups}
Yes. On a board, reps sit under their manager and managers sit under their leader, each row with its own roll-up. Expand a row to see the level below.
#### Can I see the board as it was last week? {#faq-snapshots}
Yes. Pick a past weekly or end-of-quarter snapshot from **Snapshot**, and the board shows the numbers as they stood that day.
#### Does this replace my CRM forecast field? {#faq-crm-field}
No. Forecaster can sync values back to the CRM if you configure it, but the forecast itself is kept in Oliv AI. CRM Manager is what keeps your CRM's deal fields current.
#### How is this different from built-in CRM forecasting? {#faq-crm-forecasting}
CRM forecasting relies on reps keeping fields updated by hand. Forecaster analyzes the pipeline itself and gets smarter every week, with CRM Manager keeping the fields current.
#### We already have a pipeline visibility tool. Do we still need Forecaster? {#faq-existing-tools}
Visibility tools show you the pipeline. Forecaster removes the manual work of building the forecast, which is a different problem. Many teams run it alongside their existing tools.
#### How does setup work? {#faq-setup}
Connect your CRM, set targets and define your cadence. Most teams are live within two weeks, with no rep training.
#### What if our CRM data is messy? {#faq-messy-crm}
Forecaster works with [CRM Manager](https://www.oliv.ai/product-docs/agents/crm-manager/) to keep the pipeline current. If data is incomplete, CRM Manager improves it as it goes, so you don't need a clean CRM to start.
#### Is there a minimum team size? {#faq-team-size}
It delivers the most for teams with five or more reps and at least one manager layer. Smaller teams get the time savings straight away.
#### Does Forecaster send anything to managers? {#faq-notifications}
Yes. The Weekly Forecast report arrives in My Reports every Monday. Managers also get a weekly summary of the team forecast with flagged deals, in [Slack](https://www.oliv.ai/product-docs/integrations/slack/) or email.
#### What is the difference between commit and best case? {#faq-commit-vs-best-case}
Commit is the number you stand behind: the deals you expect to close in the period. Best case adds deals that could close if things go right. Forecaster can suggest moving a deal between categories, with a reason on the deal.
## Further reading {#further-reading}
- [Focus on 3 Pipeline Metrics to Improve Your Sales Forecast](https://www.gartner.com/en/documents/7952073) (Gartner, 3 June 2026): why Gartner points forecasters toward pipeline measures over more seller input.
- [Gartner says the traditional linear sales process no longer exists](https://www.gartner.com/en/newsroom/press-releases/2019-11-13-gartner-says-the-traditional-linear-sales-process-no-) (Gartner, 13 November 2019): why stage completion is a weak guide to the odds of closing.
- [HubSpot's default deal properties](https://knowledge.hubspot.com/properties/hubspots-default-deal-properties) (HubSpot Knowledge Base): how forecast category and weighted amount are defined.
- [Set up and manage object pipelines](https://knowledge.hubspot.com/object-settings/set-up-and-customize-pipelines) (HubSpot Knowledge Base): where each stage's probability is set.
- [The forecaster's toolbox](https://otexts.com/fpp3/toolbox.html#sec-simple-methods) (Forecasting: Principles and Practice, an open textbook): how forecast errors, percentage errors and bias are worked out.
## Related {#related}
- [Forecaster on oliv.ai](https://www.oliv.ai/agents/forecaster): the agent's own page, with its operating modes.
- [The Oliv Forecast app](https://www.oliv.ai/oliv-forecast): forecast boards, deal inspection and scenario modelling.
- [The Monday rollup, retired](https://www.oliv.ai/blog/ai-revenue-forecasting-software): how agentic forecasting replaces the weekly scramble.
- [AI sales forecasting software compared](https://www.oliv.ai/blog/best-ai-sales-forecasting-software): what to weigh across tools.
- [Agentic forecasting webinar](https://www.oliv.ai/leadership-webinar): moving to agent-led forecasting.
- [Agent tools and run modes](https://www.oliv.ai/product-docs/agents/builder/tools-and-run-modes/): how approval settings work for agent actions.
- [Oliv AI pricing](https://www.oliv.ai/pricing): plans and what each includes.
- [Oliv AI product documentation](https://www.oliv.ai/product-docs/): every documented agent and feature.
*Updated 2 November 2026: added how a sales forecast gets built, how to measure sales forecast accuracy, the manual method with a worked example, one more question and further reading.*